
OEE & TEEP Calculation: How Context Fixes Faulty Shopfloor Metrics
Many manufacturing facilities suffer from an invisible data crisis: their Overall Equipment Effectiveness (OEE) calculation metrics are lying to them.
While production teams work tirelessly to optimize availability, performance, and quality, traditional tracking methods frequently output artificially deflated scores that crush morale and misguide continuous improvement initiatives.
The root cause is rarely poor shopfloor execution, instead, it is a failure to feed the correct operational context into your production monitoring software.
How do you calculate OEE vs TEEP accurately?
OEE (Overall Equipment Effectiveness) measures production efficiency exclusively during Planned Production Time, explicitly excluding non-working periods like weekends or holidays.
In contrast, TEEP (Total Effective Equipment Performance) calculates asset utilization against total calendar time (24/7, 365 days).
This distinction is fundamental. An accurate OEE calculation follows the standard OEE formula (Availability × Performance × Quality) and should only evaluate equipment during planned production. Expanding the measurement to calendar time changes the metric from OEE to TEEP, making a clear understanding of OEE vs TEEP essential. To maintain reliable performance data, manufacturing dashboards should clearly distinguish planned vs unplanned downtime.
The Theoretical Roots of the OEE Calculation
To understand why modern shopfloor metrics break down, we must return to the origin of Total Productive Maintenance (TPM) standards. When Seiichi Nakajima formalized the OEE methodology in the 1970s, he designed it with a highly specific denominator: Planned Production Time.
According to original TPM principles, weekends, planned holidays, and seasonal shutdowns must be excluded from the OEE equation. The framework was never intended to monitor a factory on a rigid 24-hour loop. Instead, it was engineered to answer a precise operational question: How efficiently did we operate during the exact windows we scheduled production?
Applying the OEE Formula: OEE vs TEEP
When manufacturers want to assess total asset capacity utilization, they must pivot to a different metric altogether. This is the domain of TEEP.
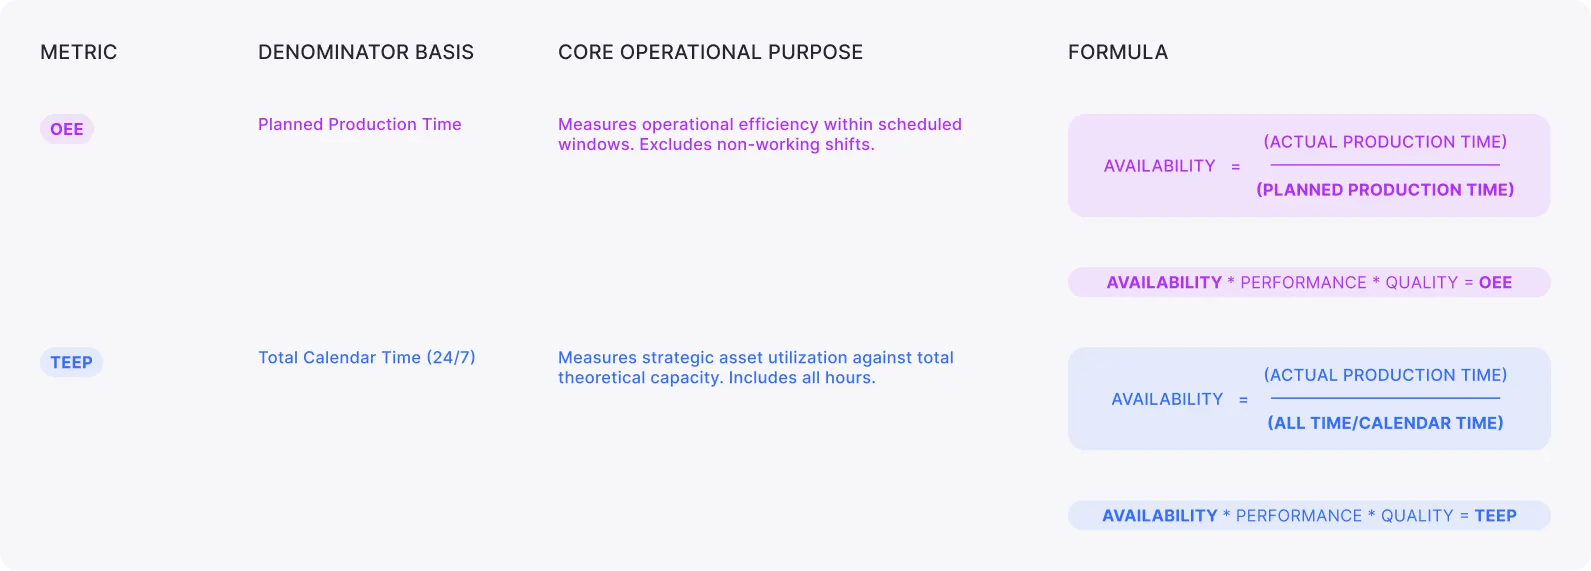
Using these metrics interchangeably creates structural data corruption. They answer completely different business questions, serve different stakeholders, and must drive different leadership decisions.
The Practical Pitfalls of bad Production Monitoring
While OEE and TEEP are theoretically distinct, standard industrial software lacks structural guardrails, forcing operators and supervisors to manually define planned calendar exceptions without integrated digital tools.
The operational consequences are predictable and severe:
- The Unjustified Weekend Penalty: When a plant shuts down for a 48-hour weekend, a disconnected system simply records continuous inactivity. Without a dynamic production calendar, those 48 hours are automatically treated as unexplained downtime, instantly tanking the availability score within the OEE calculation.
- The Unclassified Long Stoppage: Consider a production line halted for an entire shift. Management and engineering teams are well aware of the stoppage, yet if no one manually flags it in the system, the platform logs it as an unexpected breakdown. The software treats a known operational pause with the exact same severity as a critical mechanical failure.
How proGrow Adds Context to Shopfloor Metrics
To eliminate these data discrepancies, industrial platforms must bridge the gap between theoretical standards and real-world factory floors. proGrow addresses this operational blind spot through two purposeful automation features.
1. Dynamic Non-Working Time Calendars
The proGrow platform allows operations teams to configure explicit calendar events for weekends, statutory holidays, and planned seasonal adjustments. By automatically stripping these non-working blocks from the OEE denominator, the system ensures that efficiency metrics reflect only true scheduled production windows.
2. Automated Reclassification of Long Stoppages
A major stoppage lasting longer than a standard shift cannot go unnoticed in a well-managed plant. Rather than allowing unmapped data to instantly distort availability KPIs, proGrow automatically flags these extended events as "planned but unclassified."
This keeps the stoppage clearly visible on manufacturing management dashboards, allowing teams to justify the downtime later to pinpoint root causes without immediately penalizing the shop floor with false breakdown alerts. Additionally, the system enables users to define micro-stoppages, ensuring full visibility over both major operational delays and frequent minor interruptions.

The True Cost of Fabricated Downtime Data
Operating with an uncalibrated OEE calculation carries a high operational toll. When shopfloor teams notice that their real-world efficiency is routinely penalized by scheduling gaps beyond their control, they detach from the data entirely.
When operational metrics lose credibility, data-driven continuous improvement halts. Decision-making reverts to intuition, and expensive investments in production monitoring software turn into passive, ignored background screens.
Injecting honesty into your OEE calculation is not about lowering performance expectations. It is about implementing rigorous automated data integrity. When your factory metrics are transparent, accurate, and properly contextualized, teams spend less time arguing over how the numbers were calculated and more time executing tangible process improvements.
Take Control of Your Factory Metrics
Stop letting rigid software distort your true shop floor performance. If your teams are losing faith in your dashboards, it is time to build an honest, contextualized OEE calculation framework.
Learn How Quantal gained 2 more days of production per month by monitoring its shopfloor in real-time with proGrow.
Ready to eliminate false downtime penalties and drive genuine continuous improvement? Contact us today and see how automated shopfloor tracking can restore absolute integrity to your operational KPIs.

More articles
OEE & TEEP Calculation: How Context Fixes Faulty Shopfloor Metrics
Stop penalizing your shopfloor with a broken OEE calculation. Learn how to map planned vs unplanned downtime accurately using smart software.
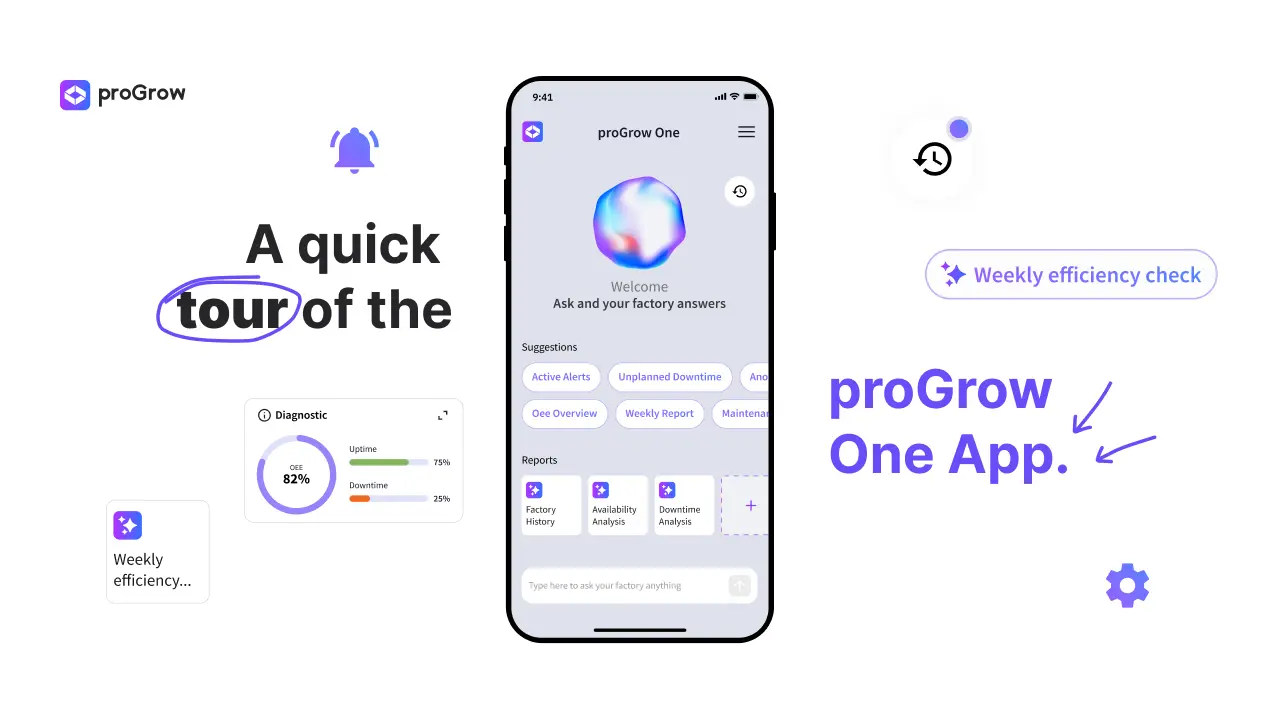
A quick tour of the proGrow One App
Learn how the proGrow One App digitalizes your factory, offering real-time OEE tracking, machine monitoring, and AI insights.
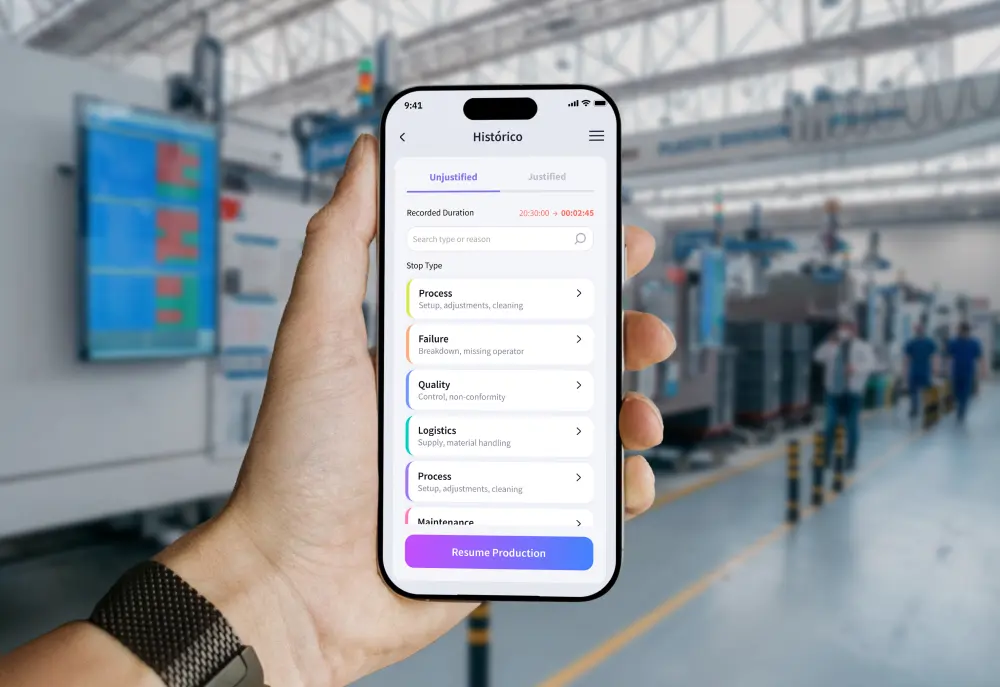
Real-Time Downtime Logging: Now Available on Mobile
Eliminate reporting lags and inaccurate OEE data. Discover how mobile downtime justification empowers operators and boosts plant capacity in real time.