

+1000
Machines Online
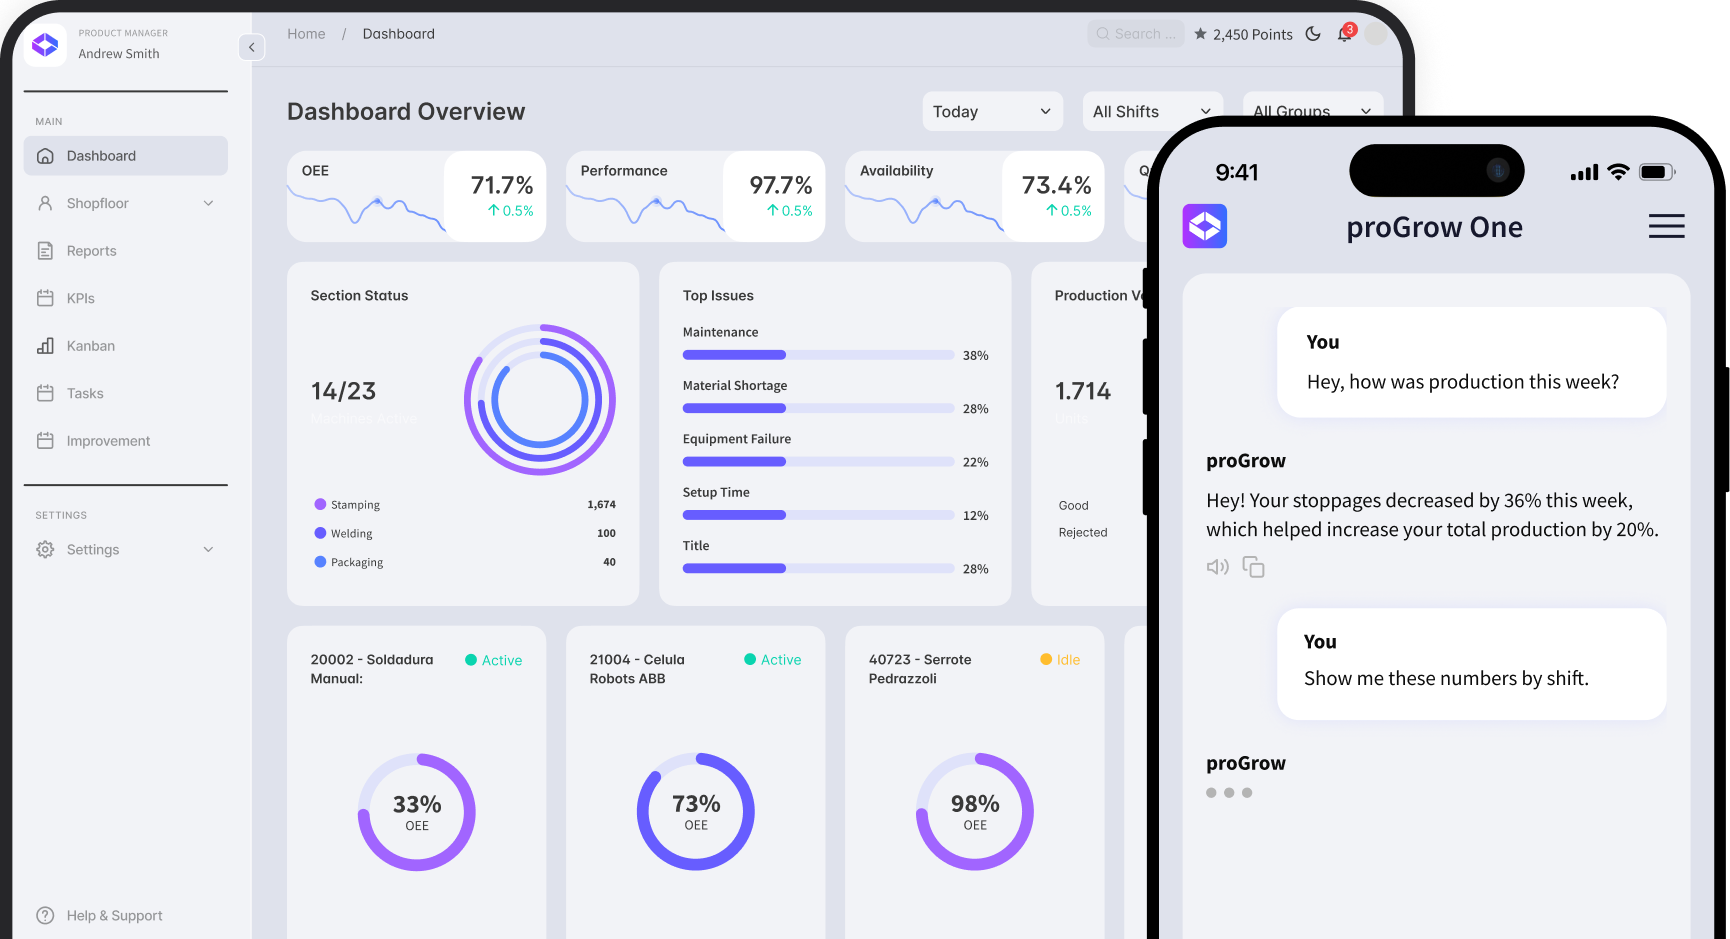
Dashboard overview showing production stats and proGrow One app chat about weekly production data.
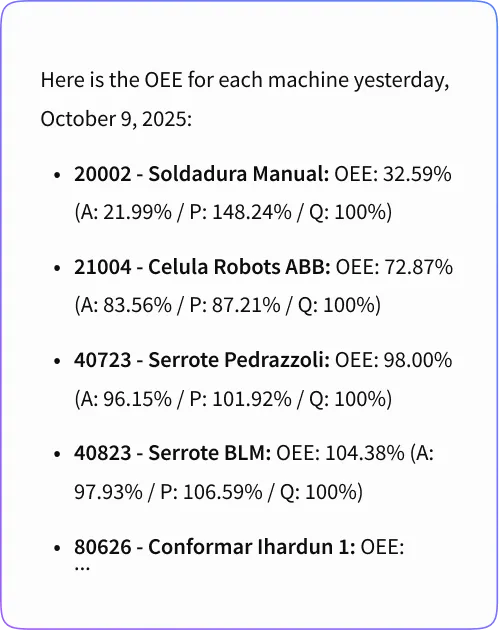
OEE report for machines on October 9, 2025, showing percentages for availability, performance, and quality.
Notification titled Production Insights dated 08 October 2025 at 03:23 AM with a purple dot.
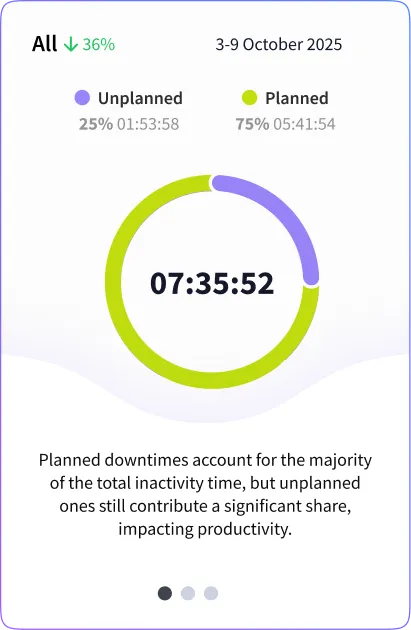
Donut chart showing 75% planned and 25% unplanned downtime totaling 7 hours 35 minutes, affecting productivity.
+3k Downloads by real users
If I was an operator, what would I want to be my top tools for success?
Zero Manual Logging: Automatically collect every alarm and micro-stoppage as it happens.

One-Click Justifications: Log reasons for every stop in seconds, keeping focus on the machine.

Live Performance Feedback: Get instant visibility on production targets directly in your hands.
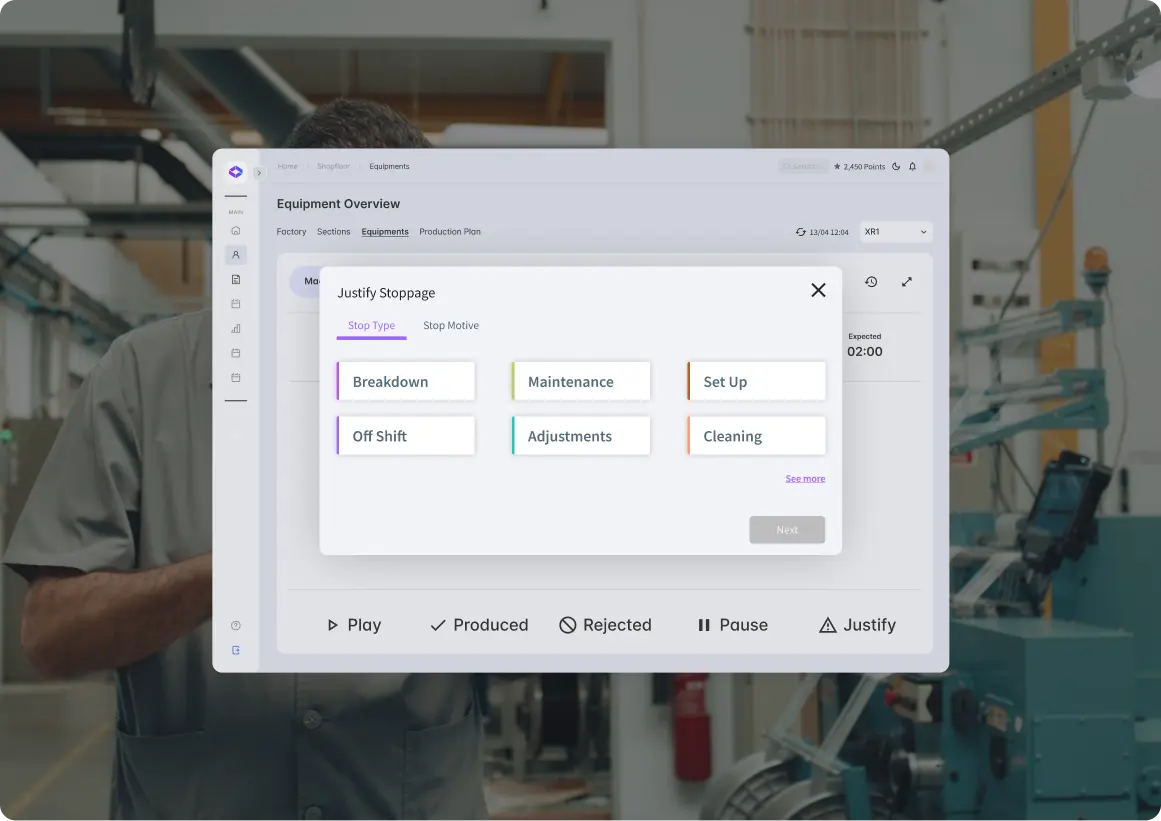
Equipment overview dashboard showing stoppage justification
Patrícia Monteiro
Operator at Lipimalhas
Santo Tirso, Portugal

"For me, the most important metric on the shopfloor is seeing the OEE circle in green, as it validates my effort and my performance. It provides an immediate incentive, allowing me to see right then and there if I’m producing more and staying above 80%."

If I was a Plant Manager, how would I  track every station in a single glance?
General Equipment Supervision: A live status map of every connected asset, from machines to assembly lines.

Section-based Layout: Group your factory by cells or lines to identify exactly where the bottleneck is.

Optimized Operational Flow: Sync maintenance, logistics and production with one shared visual command center.
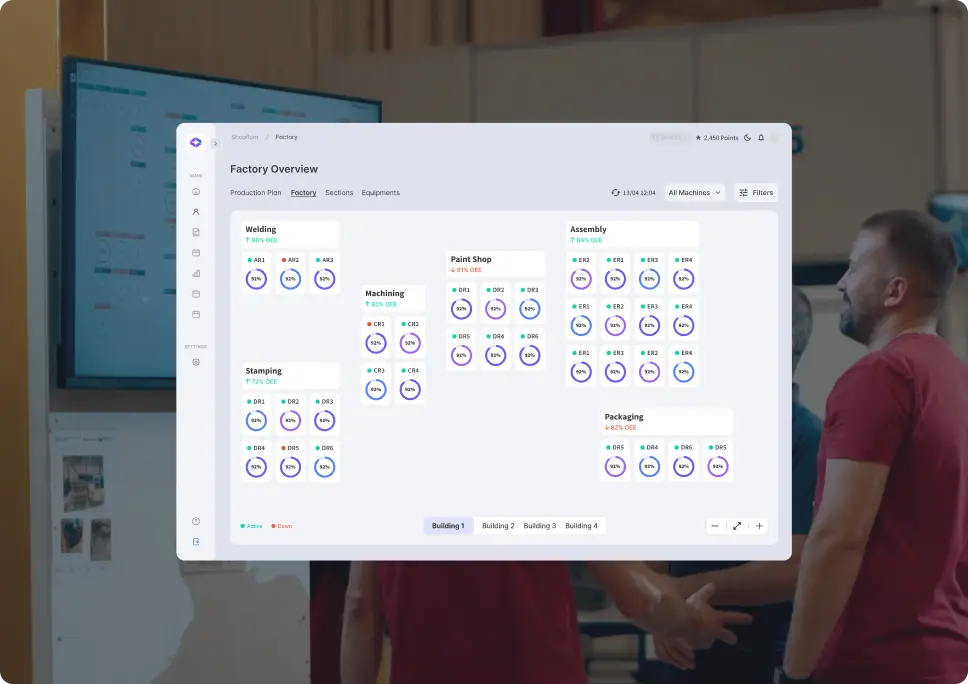
Factory overview dashboard showing status and efficiency of welding, machining, assembly, and packaging stations.
Luis Moreno
Plant Manager at Megapack
Lima, Peru

"I know we are in the other side of the ocean, but it was really easy to handle. (...) to start trying the software. Also for the maintenance team to understand how to install the devices."

How do I bridge the gap between shopfloor reality and boardroom goals?
From Gut Feeling to Data: Move beyond intuition with real-time analytics that pinpoint exactly where to intervene for maximum ROI.

Proactive Management: Shift from reacting to problems to orchestrating a smooth, optimized and predictable production flow.

Go Beyond Dashboards: Don't just look at charts. Engage with your factory through AI to uncover root causes and hidden opportunities instantly.
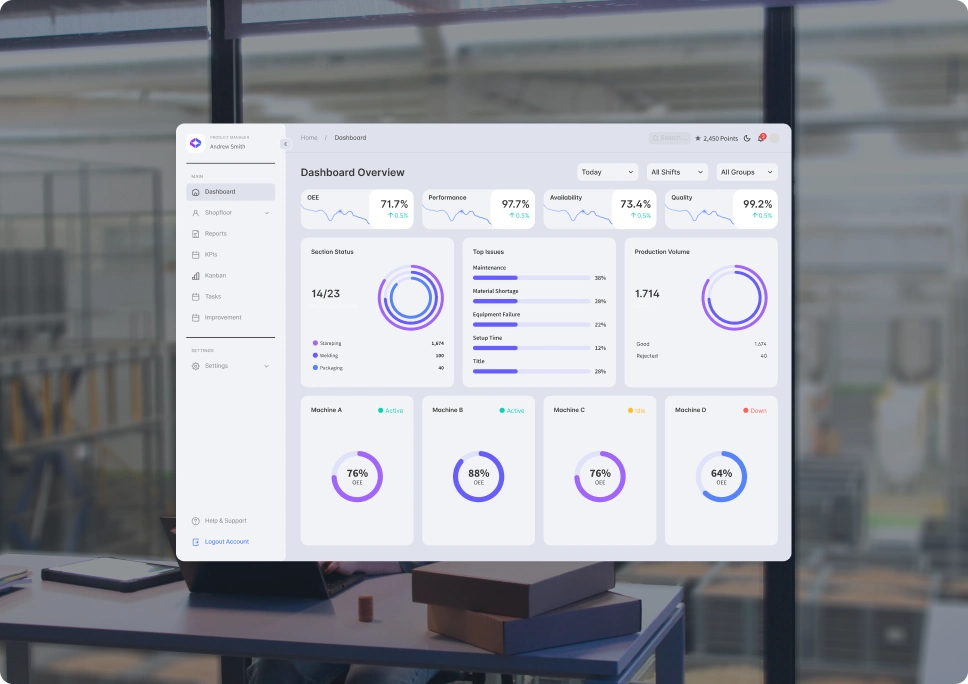
Industrial dashboard displaying OEE, performance, availability, quality, issues, and machine statuses.
Miguel Félix
Production Director at Prenso-Metal
Alcochete, Portugal

"On an everyday basis, I check the chat for machine stops on the last shift. I analyze the biggest production gaps to understand what happened, then talk to the teams involved to fix those stops. By solving small problems every day, I end up with a big cake of problems solved."

If I was the CEO, how would I spot the hidden inefficiencies hurting the bottom line?
Real-Time KPIs for Performance Tracking: Know exactly where you’re underperforming in real-time.

Target Definition and Action Monitoring: Ensure that the production targets are being met on the floor every day.

Quality Control & Automated Analysis: Identify why rejections happen instantly to prevent silent losses in your production.
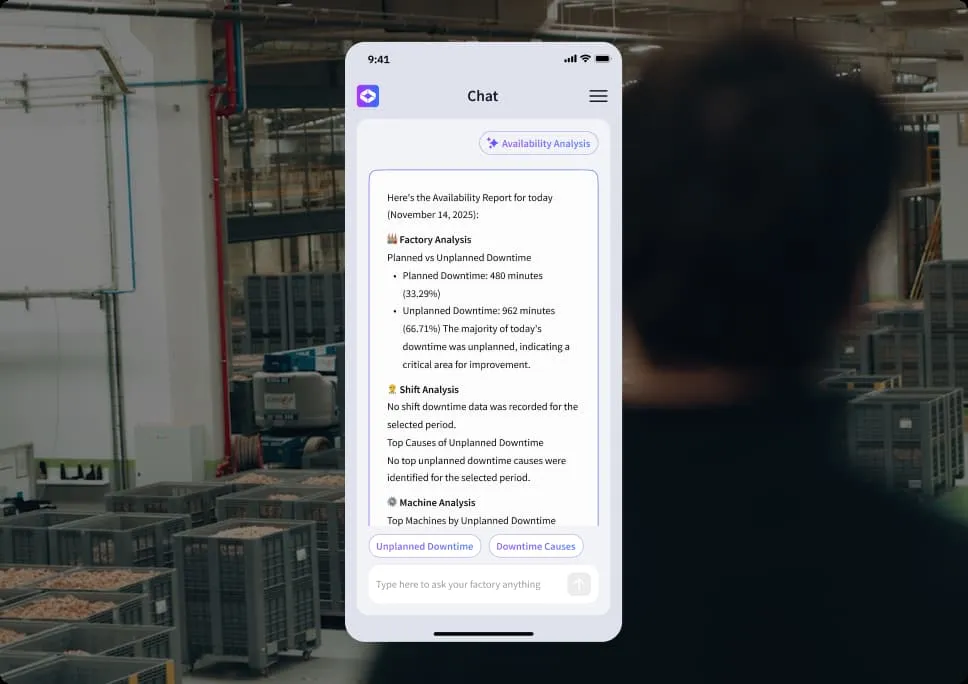
Person viewing a mobile screen with a factory availability report showing planned and unplanned downtime analysis.
Rui Baptista
CEO at WEDRONE
Porto, Portugal

"We now monitor KPIs at every level — from tablets on the shop floor to my mobile phone — allowing for real-time visibility. The ability to instantly connect a failure to an action plan is a game-changer for us."

Lost in dashboards?
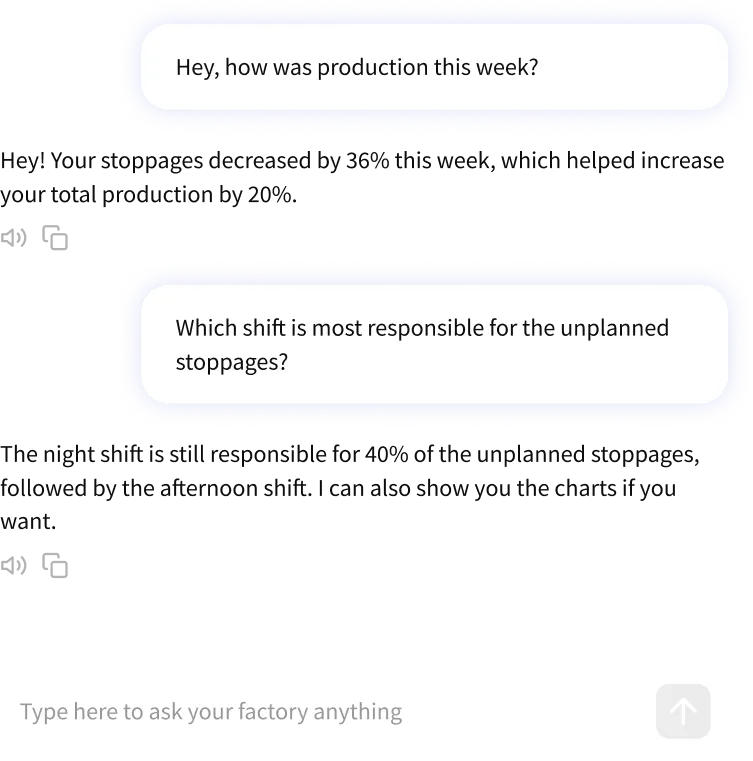
proGrow answers your factory floor questions and interprets key insights.
Chat interface showing questions about production and unplanned stoppages in a factory.
Smart Alerts
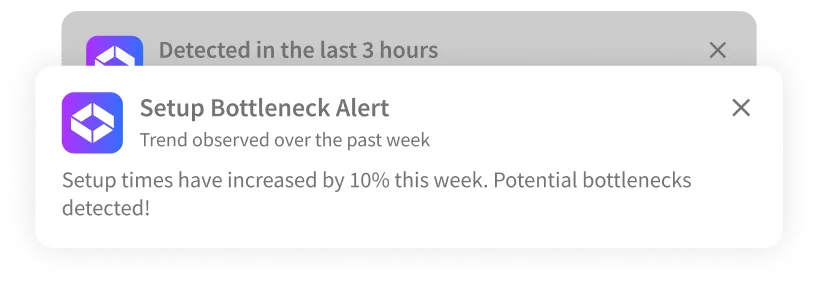
Receive real time alerts about what’s going in the factory.
Notification showing a Setup Bottleneck Alert with a 10% increase in setup times this week.
Smart Insights
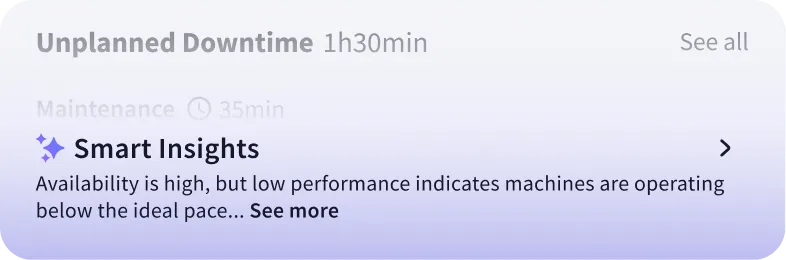
Production at a glance. Highlights your main production events so you can act faster.
Dashboard section showing Unplanned Downtime 1h30min and Smart Insights on low machine performance.
Your Manufacturing Supervision Agent
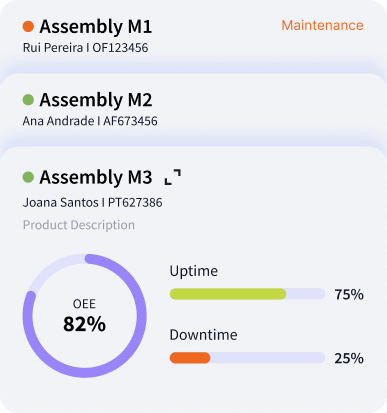
Your production, right in your pocket. Instantly see which machines stopped and  track every detail of your factory, whenever you are.
Dashboard showing assembly lines M1, M2, M3 with status, OEE 82%, uptime 75%, downtime 25%.
Icebreakers
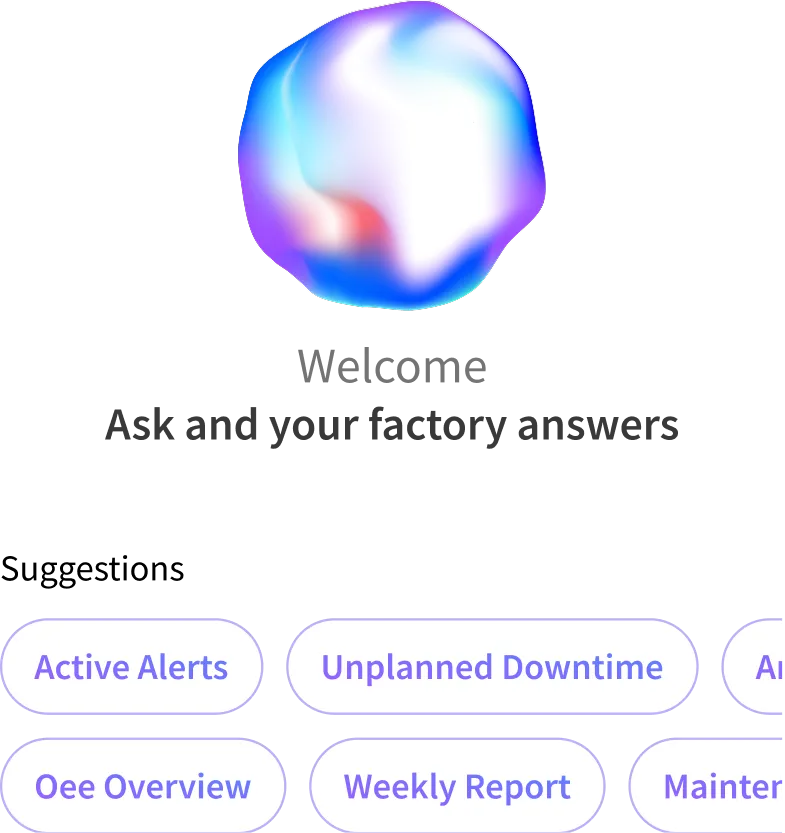
Insights in one tap. Skip the typing and jump straight into the Chat AI for data that matters.
Abstract multicolored sphere with 'Reactor' and six labeled buttons below related to alerts and reports.
Reports
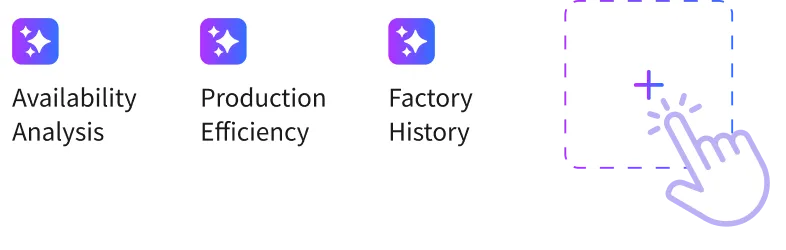
Automate custom reports and get the exact KPIs your operations demand.
Icons labeled Availability Analysis, Production Efficiency, Factory History, and a clickable plus symbol with a hand cursor.
Download the App
Get the proGrow App on your mobile device to start.
Download here.
Set your profile
Answer a few questions and login in your account.
Request your IoT
Order your IoT Device to connect your factory floor.
Digitalize your Machine
Easily install the devices on your machines.
Start Optimizing
Get AI-powered real-time insights and take full control of your production.
Join 100+ factories using proGrow
Blue industrial textile weaving machine with threads and attached digital control tablet.
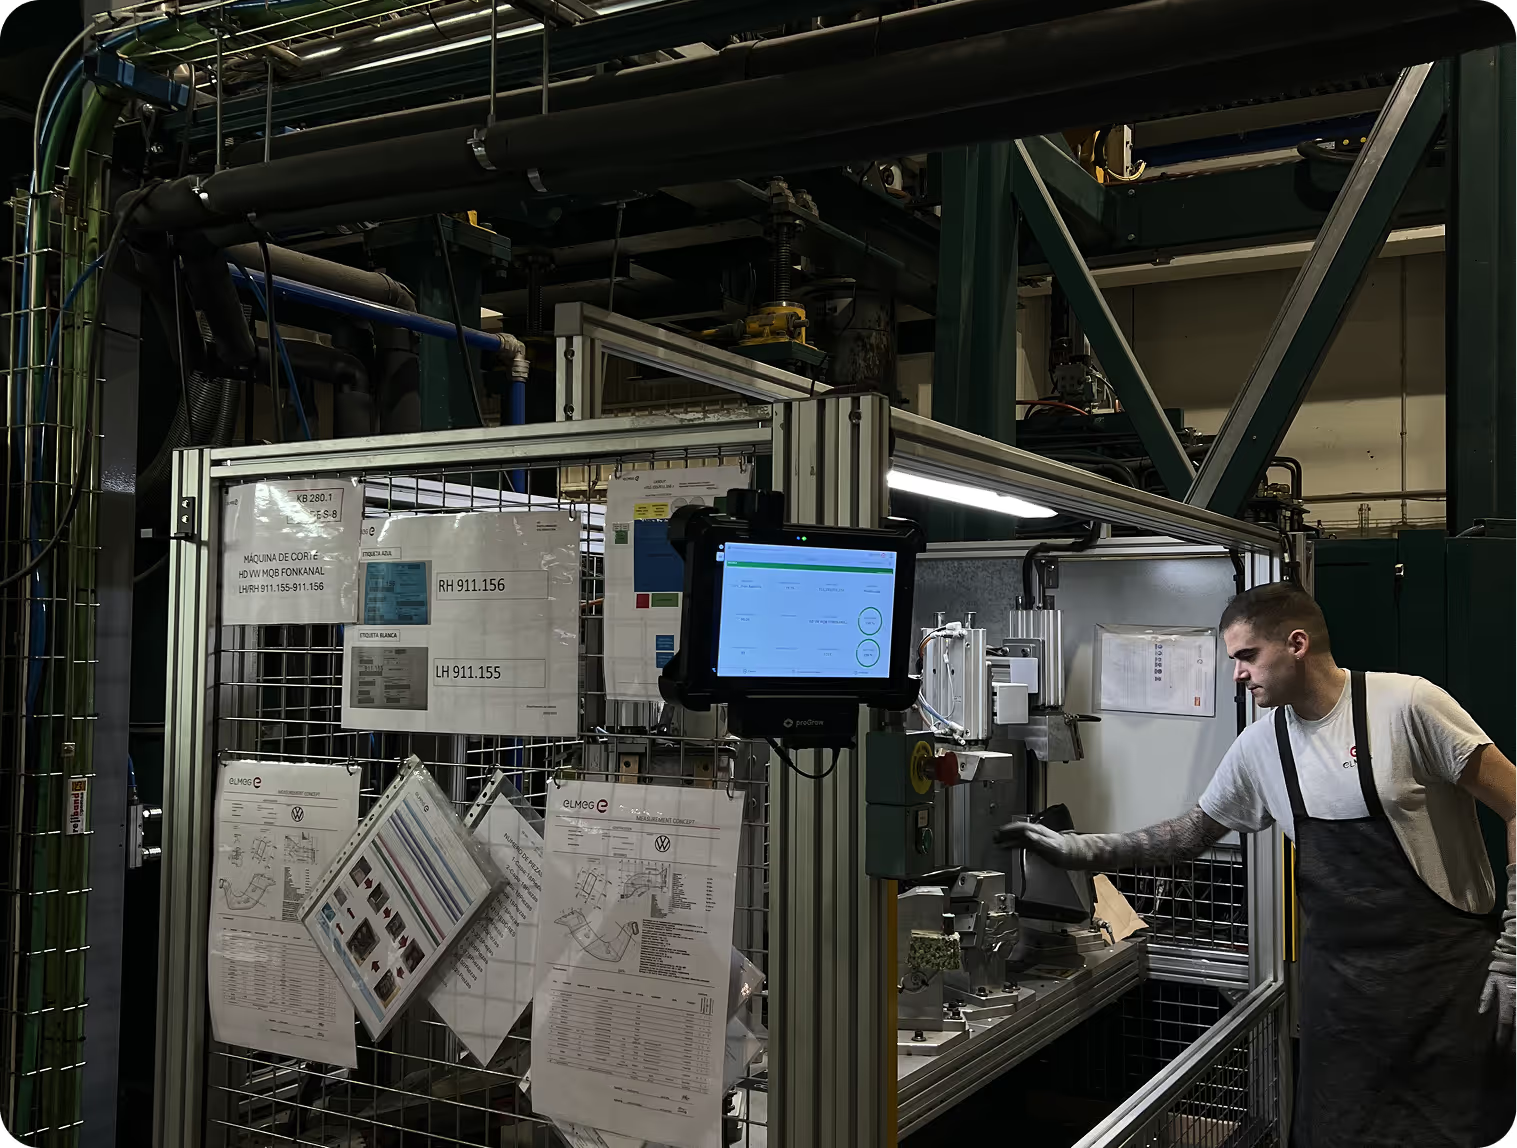
Worker in apron operating machinery inside industrial factory with control screen and documents.
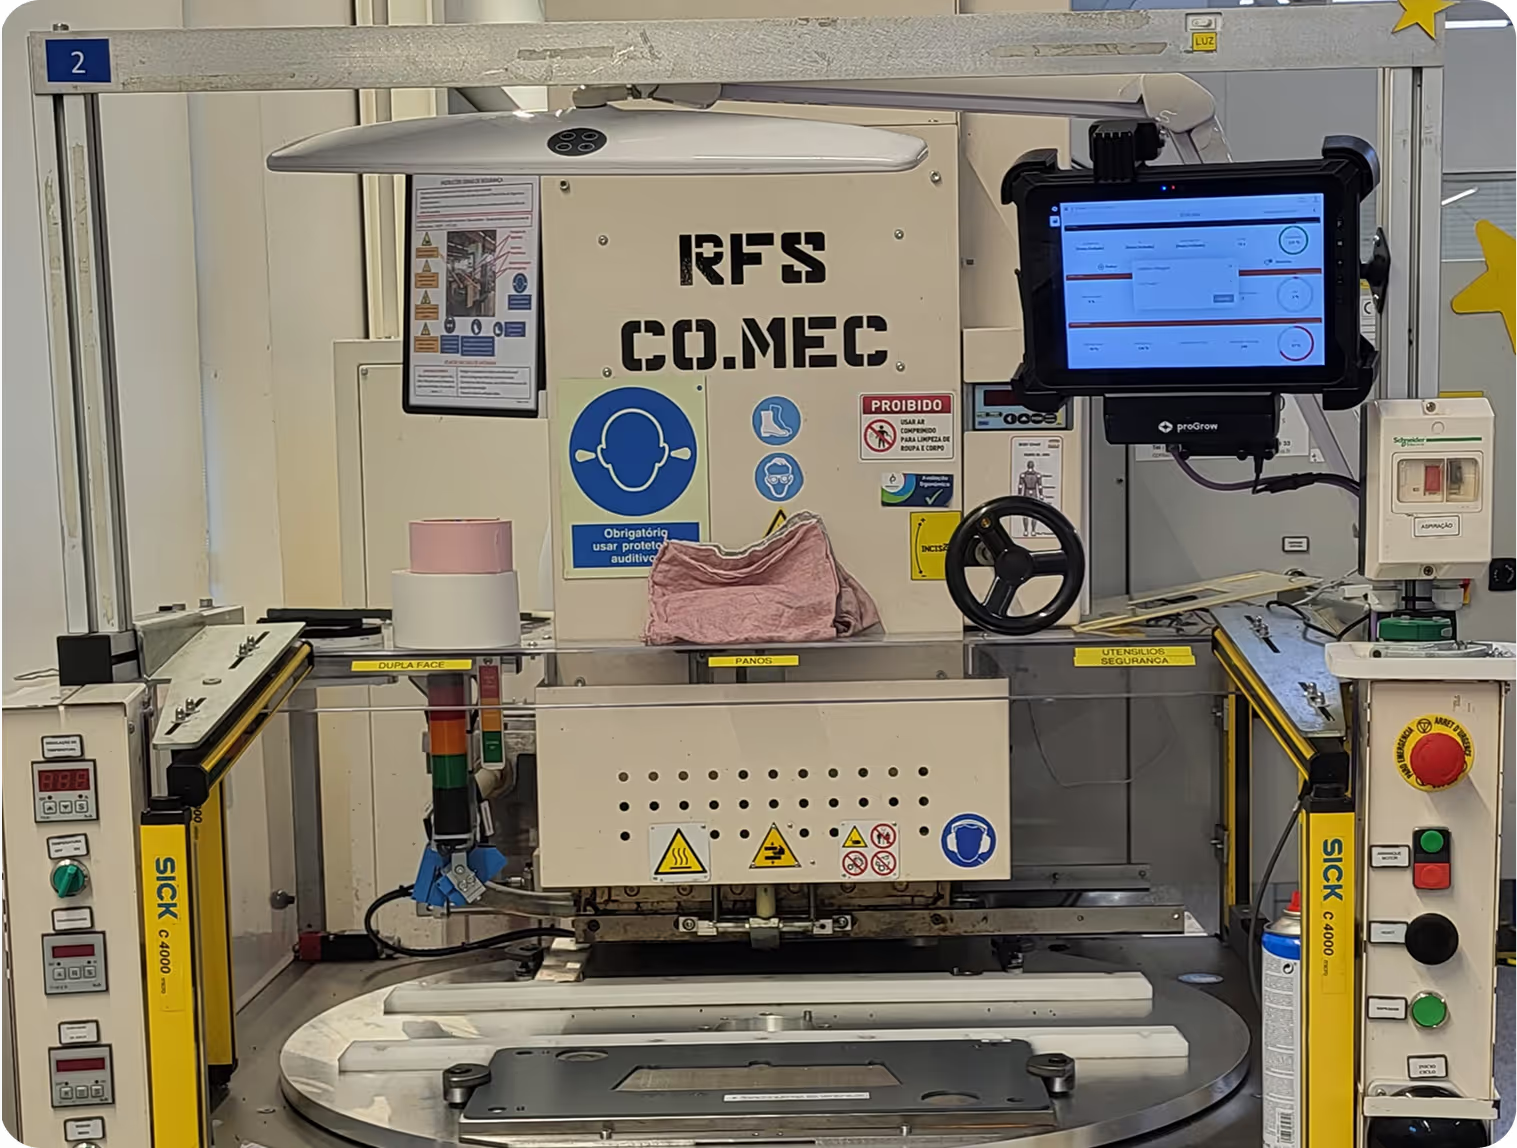
Industrial machine labeled RFS COMEC with control panel, warning signs, and a monitor on the right side.
Control panel with mounted touchscreen device displaying blurred interface on industrial machine.
Textile machinery weaving white and pink threads with a digital control panel and screen.
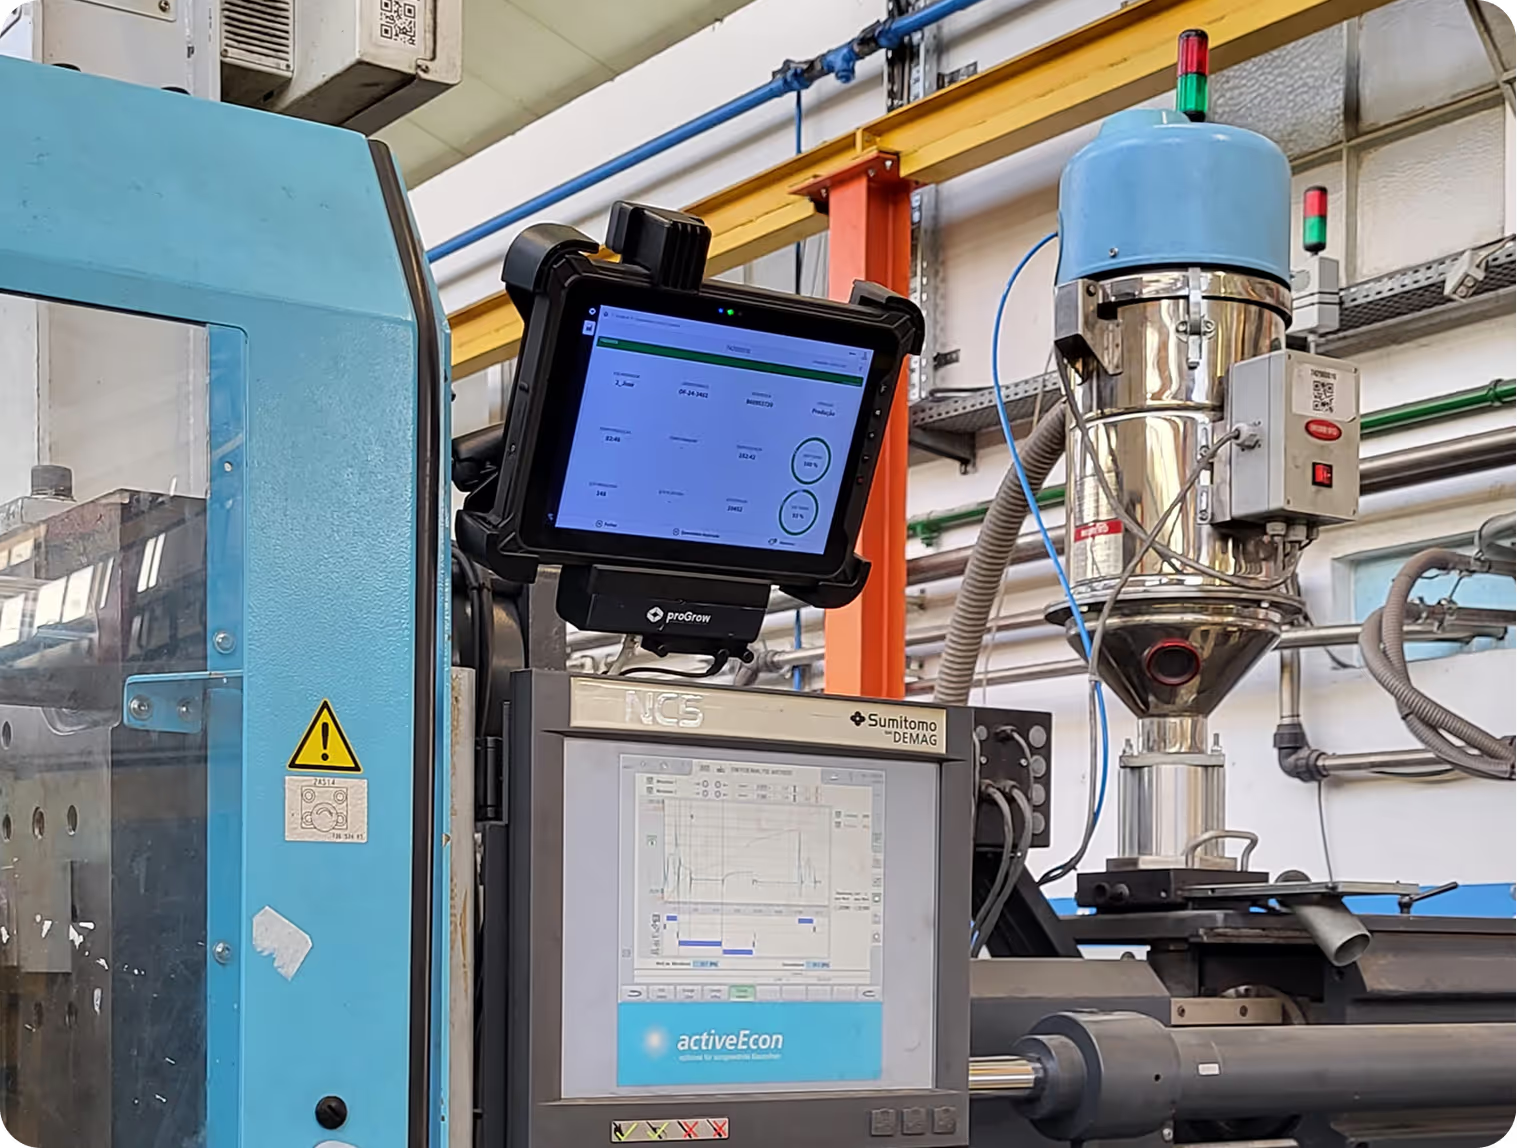
Industrial machinery with digital control panels, blue casing, and connected pipes in a factory setting.
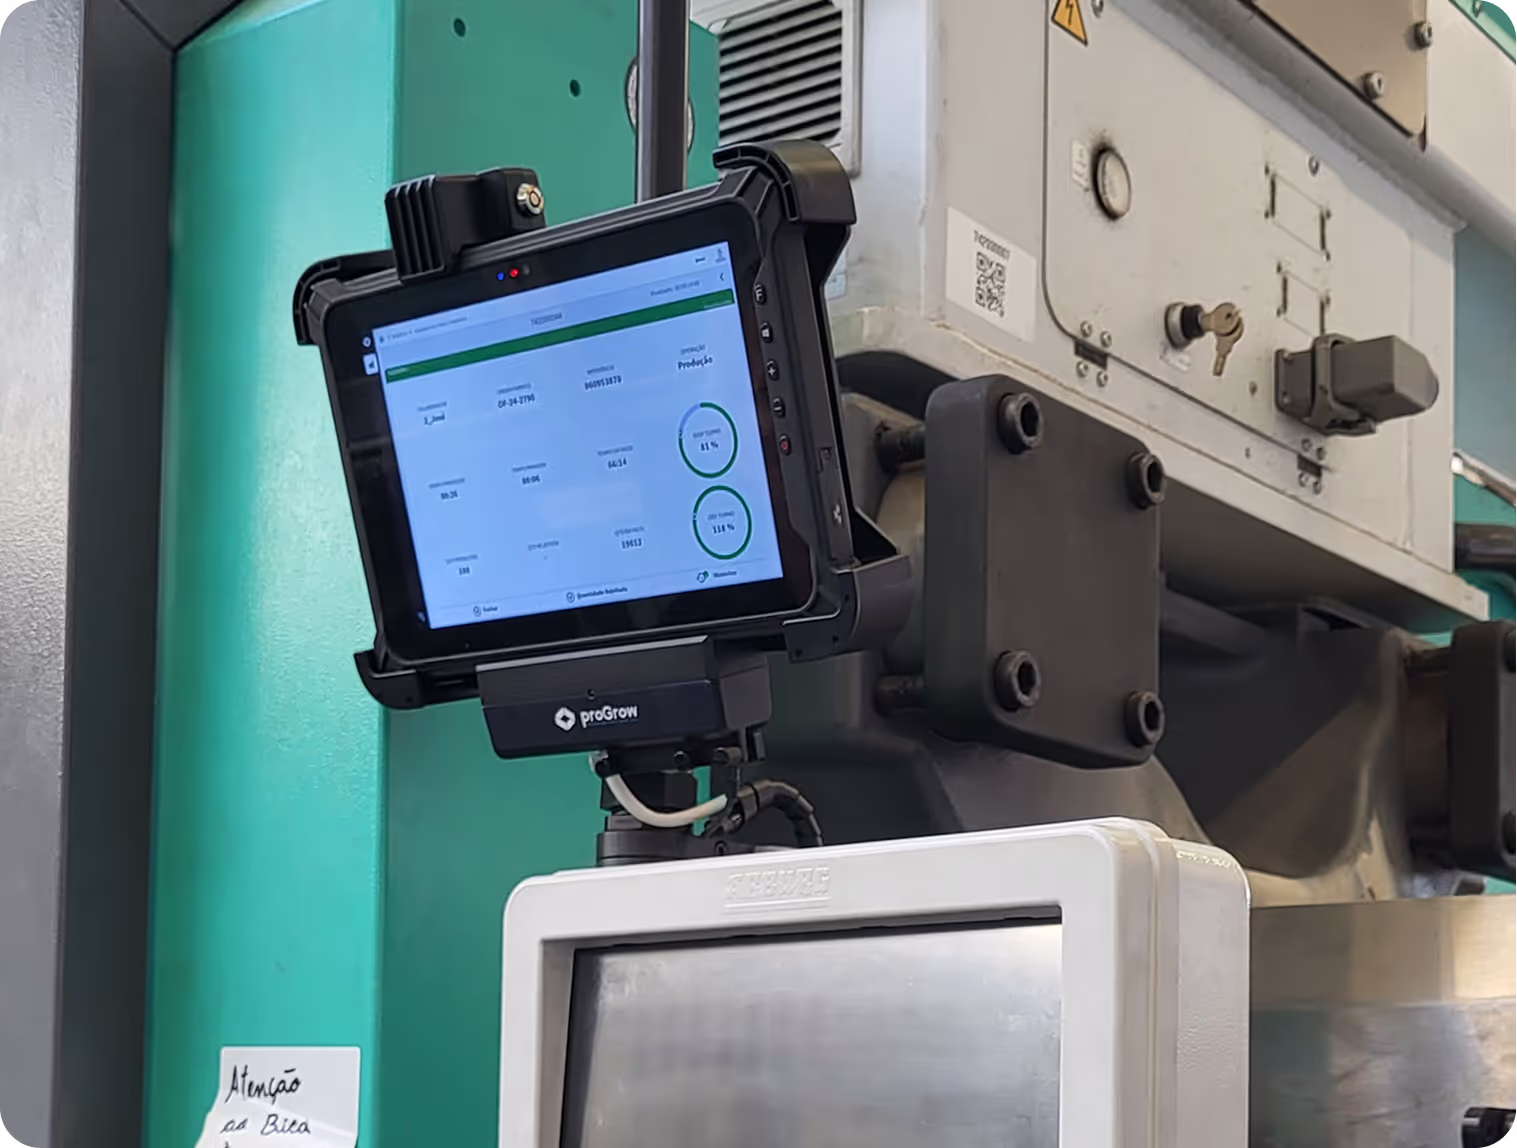
Tablet screen mounted on industrial machine console displaying production dashboard with metrics and progress circles.

The proGrow journey:
your shopfloor digitalization starts here.

Discover the best fit for your production. From real-time industry monitoring to advanced OEE optimization, we provide the data contextualization you need to lead.

Start simple and scale as your needs grow, each stage brings you closer
to a smarter, more connected and more efficient shopfloor.
No matter where you start, proGrow grows with you.
See Plans