

Machine Hourly Cost Calculation: Solving Shopfloor Financial Losses
In modern manufacturing facilities, a lack of real-time visibility into equipment expenses often leads to disconnected systems and reactive maintenance strategies. Without an accurate machine hourly cost calculation, operational metrics like Overall Equipment Effectiveness (OEE) remain abstract percentages rather than clear monetary values.
A machine hourly cost calculation is a financial methodology that aggregates capital depreciation, energy consumption, direct labor, maintenance, and factory overhead into a standardized hourly rate for an industrial asset. Based on Lean
Manufacturing principles, determining this localized rate enables manufacturing leaders to translate performance, availability, and quality losses into precise financial metrics to drive continuous improvement.
Why Perfect Factory Cost Data is the Enemy of Progress
The primary objective of calculating your machine rate is not absolute accounting perfection; it is to establish a data-driven baseline that reflects your shop floor reality better than any generic industry estimate.
Establishing an approximated but localized machine hourly cost allows you to instantly identify the assets causing the highest financial drain, compare performance across shifts, and maintenance budgets with concrete data.
Your financial precision can be continuously optimized over time as more data populates your system.
What are the 3 Methods to Calculate Machine Hourly Cost?
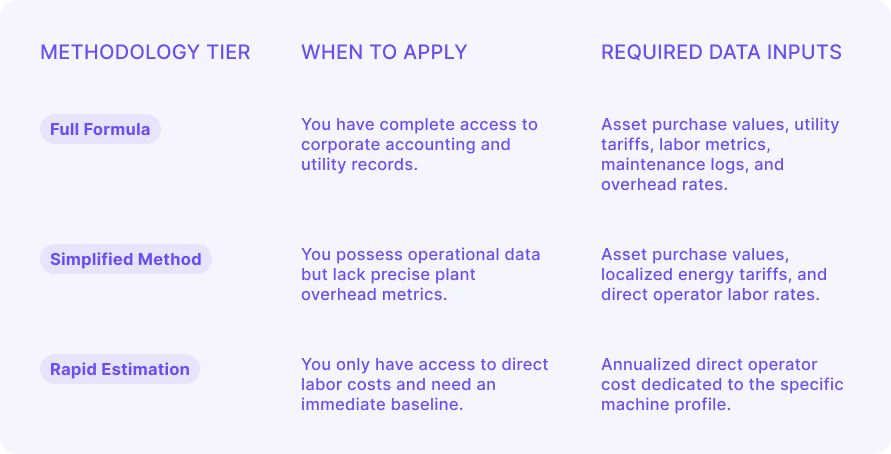
Depending on your current data availability within your Manufacturing Execution System (MES) or Enterprise Resource Planning (ERP) software, you can select one of three operational tiers, ordered by accounting rigor.
Tier 1: The Comprehensive Machine Hourly Cost Formula
The complete Machine Hourly Cost (MHC) formula serves as the financial engine for advanced Industry 4.0 performance platforms like proGrow. It unifies five distinct operational pillars into a single rate:


1. Depreciation (D)
Depreciation represents the systematic loss of an asset's value over time, a practice aligned with international asset management frameworks like ISO 55000.

- Acquisition Value: The net financial capital expended to purchase, transport, install, and commission the machinery.
- Residual Value: The estimated salvage or resale value at the end of the equipment's operational lifecycle (use 0 if uncertain).
- Useful Life in Hours: Total expected operating hours over the asset lifespan, calculated as Years of Expected Service×Operational Hours per Year.
Practical Example: A machine is acquired for €120,000 with zero residual value. The estimated lifecycle is 10 years at 4,000 operating hours per year (40,000 total lifetime hours).
D = (120,000 − 0) / 40,000 = €3.00 per hour
2. Energy (E)
Energy tracking accounts for active power draw during machine operation, preventing utility price volatility from masking real production costs.

- Nominal Power: The rated capacity stated on the equipment’s electrical nameplate or manufacturer technical documentation.
- Utilization Factor: Heavy machinery rarely operates at peak electrical capacity throughout a cycle. Industry research shows that a factor of 0.7 serves as an accurate baseline for general-purpose discrete manufacturing equipment.
- Energy Tariff: The active localized rate per kilowatt-hour derived from the facility's industrial utility invoices.
Practical Example: A production system features a 15 kW nominal power rating, operates at a 0.7 utilization factor, and is subject to a €0.14/kWh electricity tariff.
E = 15 × 0.7 × 0.14 = €1.47 per hour
3. Direct Labor (DL)
Direct labor isolates the specific cost of human capital required to monitor, set up, and run the specific industrial asset.

- Total Annual Cost: Gross wages combined with mandatory social contributions, insurance, and benefits. In regions like Iberia, this equates to roughly Gross Salary×1.27.
- Annual Productive Hours: Actual hours spent by the operator performing value-add tasks on the shop floor, excluding planned closures or extended leave. A standard single-shift baseline is 1,700 hours per year.
Note: If a cross-trained operator manages a multi-machine cell simultaneously, divide the total burdened labor cost by the number of active machines assigned to that operator.
Practical Example: An operator costs the company a total of €22,000 annually, is 100% dedicated to a single machine, and logs ,1700 productive hours per year.
DL= 22,000 / 1,700 = €12.94 per hour
4. Maintenance (MN)
This captures the costs of maintaining asset health, combining planned preventive maintenance, reactive repairs, spare parts, and third-party service Level Agreements (SLAs).

If asset-level maintenance logs are missing from your current CMMS or ERP system, calculate an initial factory-wide average by dividing total plant maintenance expenses by the total number of operational machines.
Practical Example: An asset accumulates €8,000 annually in replacement parts and technical servicing while running 3,500 hours per year.
MN = 8,000 / 3,500 = €2,29 per hour
5. Manufacturing Overhead (OH)
Overhead represents indirect manufacturing costs that must be distributed across equipment, including square footage footprint costs, plant-wide industrial insurance, facilities utilities, and supervisory staff salaries.

If your shop floor contains mixed manufacturing processes with vastly different footprints or power requirements, you can weight this allocation by square meters occupied or total installed kilowatt capacity to maintain granular precision.
Alternative Approaches: Simplified and Rapid Calculations
When localized asset tracking is incomplete or your organization is in the early stages of a digital transformation, waiting for perfect data can delay important continuous improvement projects.
Tier 2 — Simplified Cost Calculation
If overhead records are unavailable, isolate the three primary operational pillars:

In discrete manufacturing applications, this variation consistently covers 75% to 85% of true machine expenses. This calculation provides enough accuracy to track the financial impact of downtime and compare variance across production shifts.
Tier 3 — Rapid Multiplication Factor
When only labor cost profiles are available, apply an industrialized multiplier based on European discrete manufacturing benchmarks to account for systemic equipment costs:

This factor serves as a conservative baseline, allowing you to estimate asset costs while you compile your plant’s energy, depreciation, and maintenance datasets.
Industrial Case Study: High-Performance CNC Machining Center
To understand these calculations in a real-world scenario, let's look at a medium-to-high capacity CNC machining center running a specialized operator crew across two production shifts.

When factoring in extra safety margins for specific production components, specialized cutting tools, and long setup times, the actual operational cost for this profile of machinery usually settles between €65 and €80 per hour.
Continuous Improvement Note: Equipment profiles differ significantly by industry. A plastic injection molding setup, an automated robotic welding cell, or a heavy hydraulic stamping press will each exhibit unique cost structures.
For instance, injection molding shows intense energy dependency, while robotic cells carry higher initial capital depreciation.
Elevating Your OEE Financial Impact Tracking
By default, platforms like proGrow use a conservative baseline of €75 per hour. This number reflects typical mid-to-high tier industrial equipment costs across the Iberian Peninsula, balancing average depreciation, localized energy pricing, labor rates, and overhead.
However, relying on default metrics can limit your strategic visibility. Configuring real, precise hourly costs for each specific industrial asset turns raw efficiency data into exact financial insights. This visibility helps shift manufacturing plants away from paper-based tracking, giving production teams the precise numbers they need to prioritize projects, optimize maintenance, and boost profitability.
How accurate are your current machine runtime costs?
Would you like to explore how to integrate your plant's real-time energy monitoring systems directly into your machine hourly cost calculation?

More articles
.webp)
How to Justify Stoppages in the proGrow One App
Master downtime management with proGrow: easily categorize machine stoppages, edit historical records, and keep your production data 100% accurate.
.webp)
Webinar: Customer Voice in 5.0 Industry with Luís Alves
Luís Alves shares how Formaplás transformed its shop floor using proGrow's real-time connectivity, AI analytics, and digital monitoring.
.webp)
How to Use the Supervisor View in the proGrow One App
Master your shopfloor with proGrow One App’s Supervisor View. Monitor real-time OEE, track machine downtime, and boost factory efficiency.